Methodology
The Alternative Fuel Life-Cycle Environmental and Economic Transportation (AFLEET) tool developed by the Argonne National Laboratory was used to compare the two outboard technologies [4]. AFLEET estimates petroleum use, greenhouse gas emissions, air pollutant emissions, payback and total cost of ownership of various on-road equipment such as light-duty vehicles and heavy-duty vehicles, and off-road equipment such as lawn mowers and forklifts using simple spreadsheet inputs. The tool uses data from Argonne’s Greenhouse gasses, Regulated Emissions, and Energy use in Technologies (GREET) fuel-cycle model to estimate petroleum use and GHG emission coefficients for various vehicles and fuel types.
A major challenge with using this tool for our purpose is that an outboard was not one of the equipment modeled in the tool. Exploration of the equipment modeled in the tool revealed that, in the authors’ opinion, of all the equipment modeled in the tool, a chain saw had the most similar characteristics to an outboard. These characteristics include a basic electric motor system, no emissions related to break or tire wear and similar lubricant requirements. This equipment was thus adopted and its input was populated to align with the inputs obtained from the data collection phase of the project.
AFLEET estimates three categories of environmental impacts:
- Petroleum Use in barrels
- GHG emissions in tons of CO2equivalent
- Emission of main gaseous air pollutants in kilograms per year: CO, NOx, PM10, PM2.5, VOC and SOx.
AFLEET Model Inputs
The main assumptions on outboard performances come from surveys and testing on site, as elaborated in the first post [1]. These sections present a summary of the key inputs.
Performances inputs
Usage of boats: the distance traveled during each fishing trip is assumed to be 29.8 km and each fisherman is assumed to go on 15 fishing trips every month. These numbers were informed by surveys, GPS tracking campaigns and interviews carried out on the island.
Boat performances: the performance-related variables were computed as the average between Eco and Speed Mode (see previous article for details). Specifically, the considered speed is 12.6 km/h for both ICE and electric outboards. For the ICE, fuel consumption of 0.245 liters/km was assumed, corresponding to a fuel economy of 10.28 Miles Per Gasoline Gallon Equivalent (MPGGE), which is one of the key inputs of the model. On the e-outboard side the range of speed varies according to the type of engine considered, and the performance of the ePropulsion outboard in Eco Mode was selected as most representative, with an energy consumption of 0.232 kWh/km. The conversion from electricity to Gasoline Gallon Equivalent (GGE) was done with a conversion rate of 33.7 KWhe per GGE [5], which translated to 90.26 MPGGE.
Equipment lifetime: 10 years for both outboard types
Economic inputs
Purchase price: The average cost of a second hand ICE 10 HP outboard on Lolwe is 1650 US$. The cost of a second-hand ICE was used in this study because the surveys revealed that fishermen rarely have the wherewithal to afford new engines and typically procure used engines. For the e-outboard kit, the average cost inclusive of engine, tiller, battery bank, charger, propeller, cabling, shipment, taxes and import duties was 7,165 US$.
Maintenance cost: surveys show that the ICE engine maintenance requirements can vary significantly. The most common schedule is 4 services per month, at an average cost of 15,000 UGX per service (15.65 US$ per month). Considering 3,333 miles per year, the maintenance cost is 0.0563 US$ per mile. Regarding the e-outboard maintenance costs, several reports have shown that electric engines have a lower maintenance cost than ICE. In this study, we relied on a study by the Argonne National Laboratory that estimates maintenance cost from the service schedule of various ICE powertrains. The maintenance service schedule was developed using owner’s manuals of various makes and models of light-duty vehicles. This study shows that maintenance and repair cost of electric engines can be expected to be about 60% of the maintenance and repair cost of ICE. With this assumption, the maintenance cost of the e-outboards was taken as 0.034 US$ per mile.
Maintenance costs yearly increment: 5%
Cost of fuel on Lolwe island: 1.671 $/liter (as per August 2022).
Cost of and electricity: the tariff of the Lolwe mini grid was considered, which is 0.39 US$ per kWh. This tariff will remain fixed for the whole duration of the project.
Financial inputs: since all our calculations are done in USD, we adopt the current inflation rate of the US (8.5%). A discount rate of 10.3% was assumed.
Yearly depreciation rate: fixed rate of 10% such that the vehicle has no resale value at the end of the expected lifetime of 10 years.
Financing terms: interest rate of 30% for a 2 years loan, with 30% down payment.
Source of energy: the source of energy for the e-outboards is the mini grid, which is powered by a solar PV plant equipped with Li-ion battery storage and diesel genset as backup. By the company’s operation philosophy, the electric vehicles are recommended to only be charged between 8AM and 5PM and exclusively from direct solar PV generation. Thus, it can be assumed that the charging system runs on 100% renewable energy.
Result of Environmental Impact Assessment
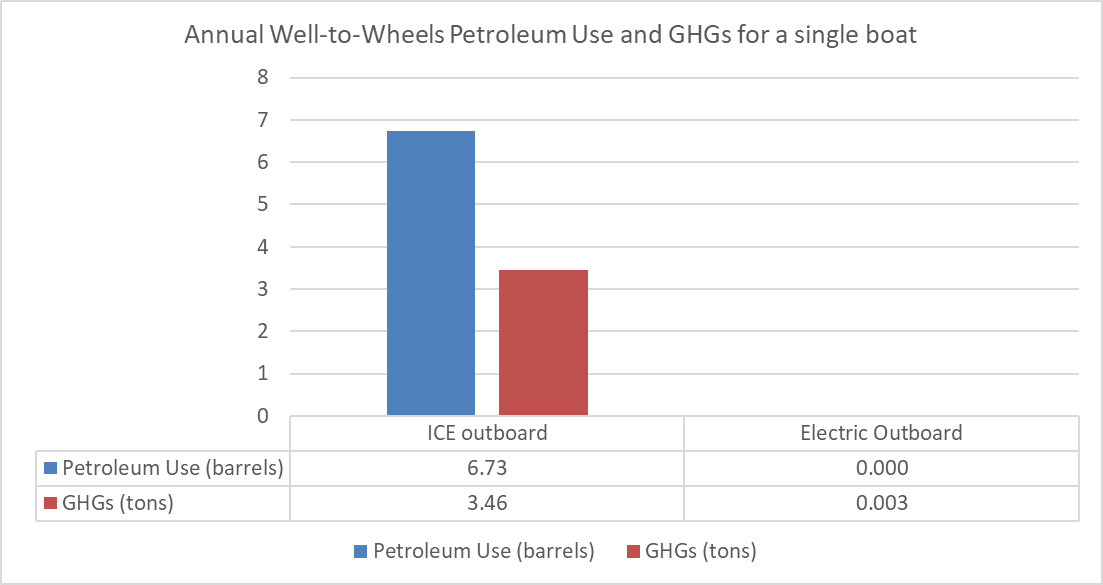
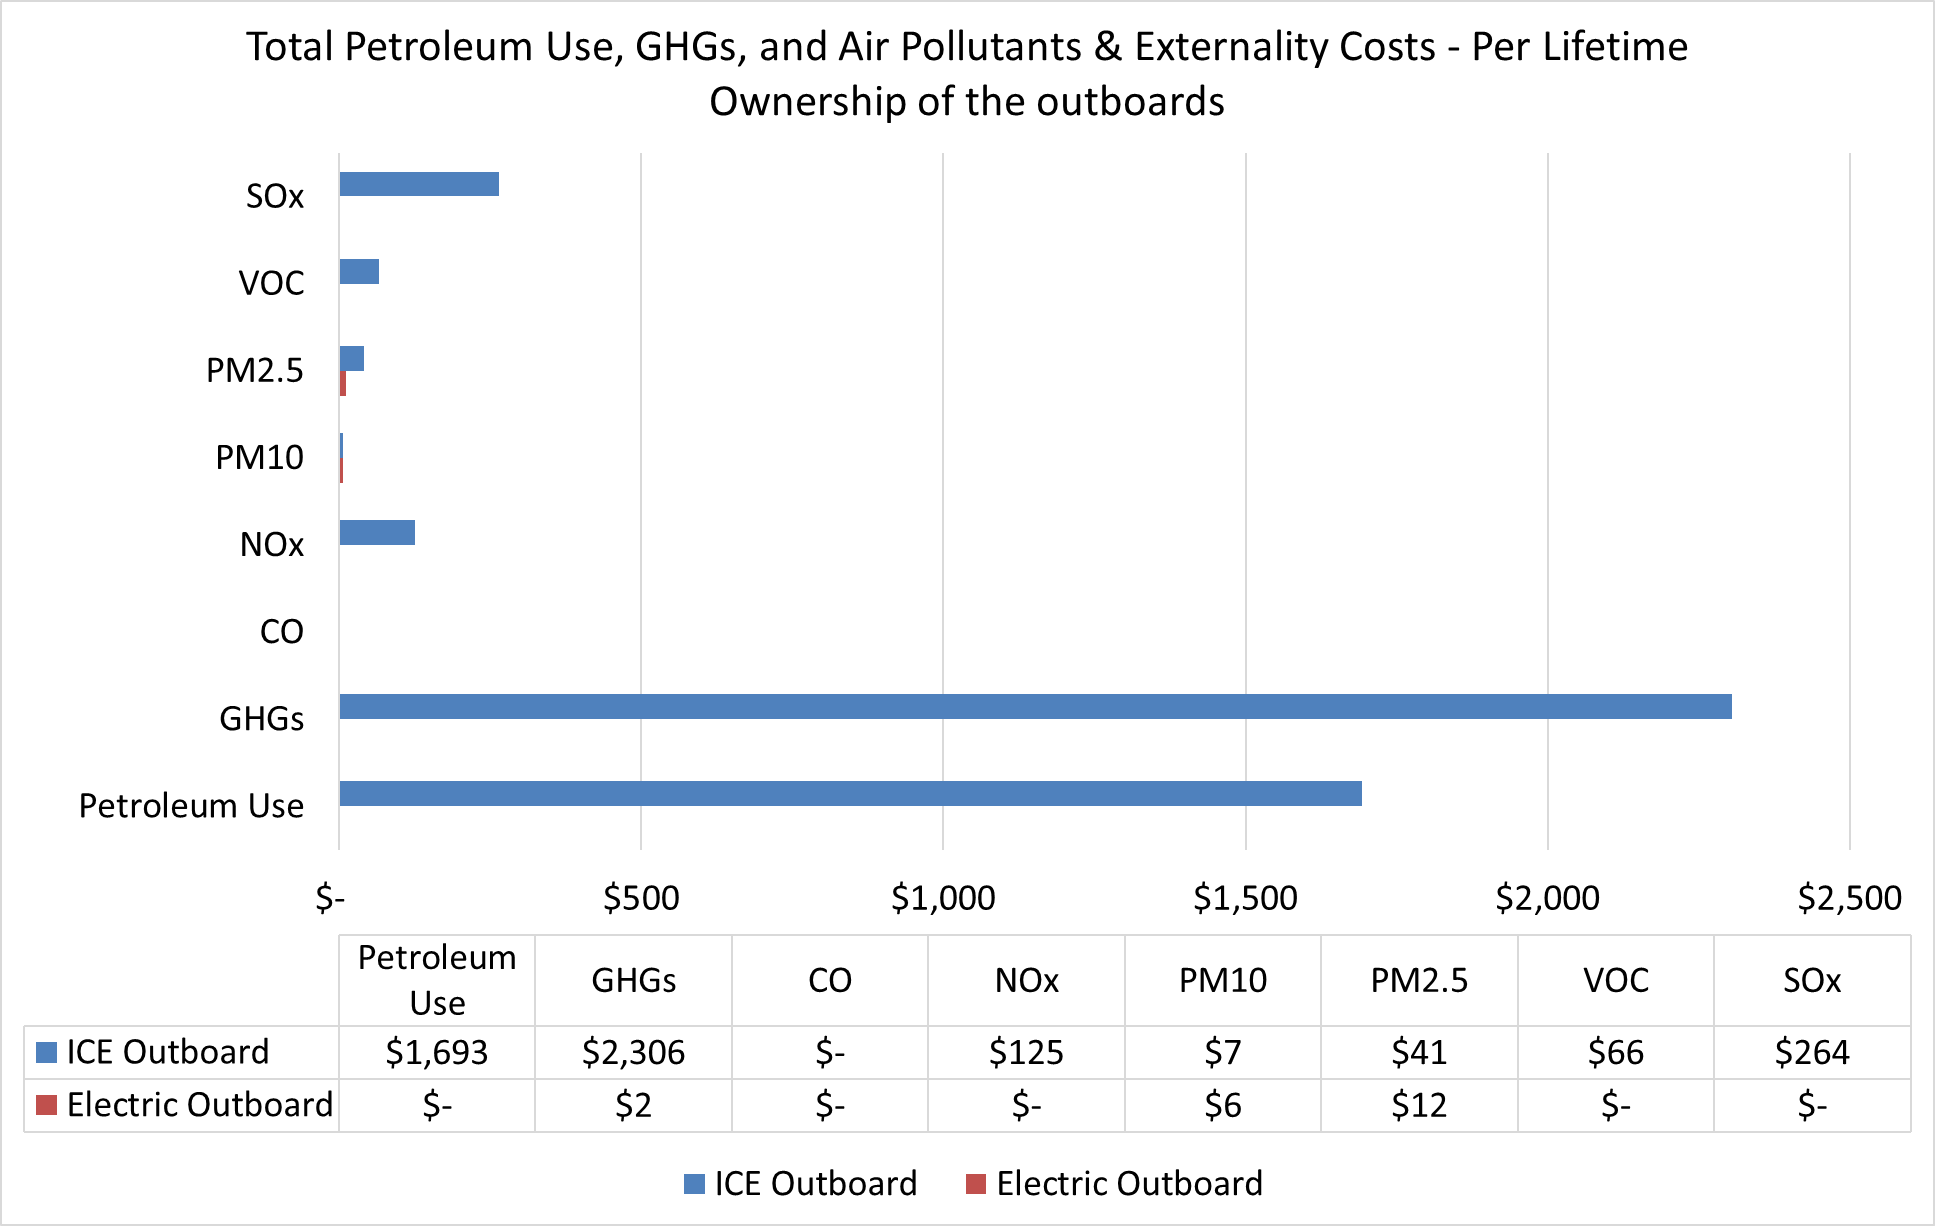
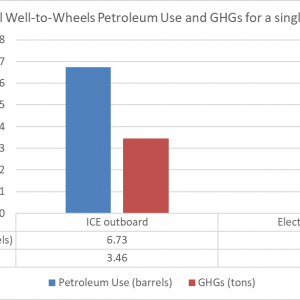
The following chart and table reports the WTW impact of the petroleum use and GHG emissions for the 2 technologies. The result indicates a saving of around 3.46 tons of CO2 equivalent GHG for each boat per year. This means that assuming a 10 year operation of 15 outboards, the total GHG saving would be around 519 tons of CO2 equivalent.
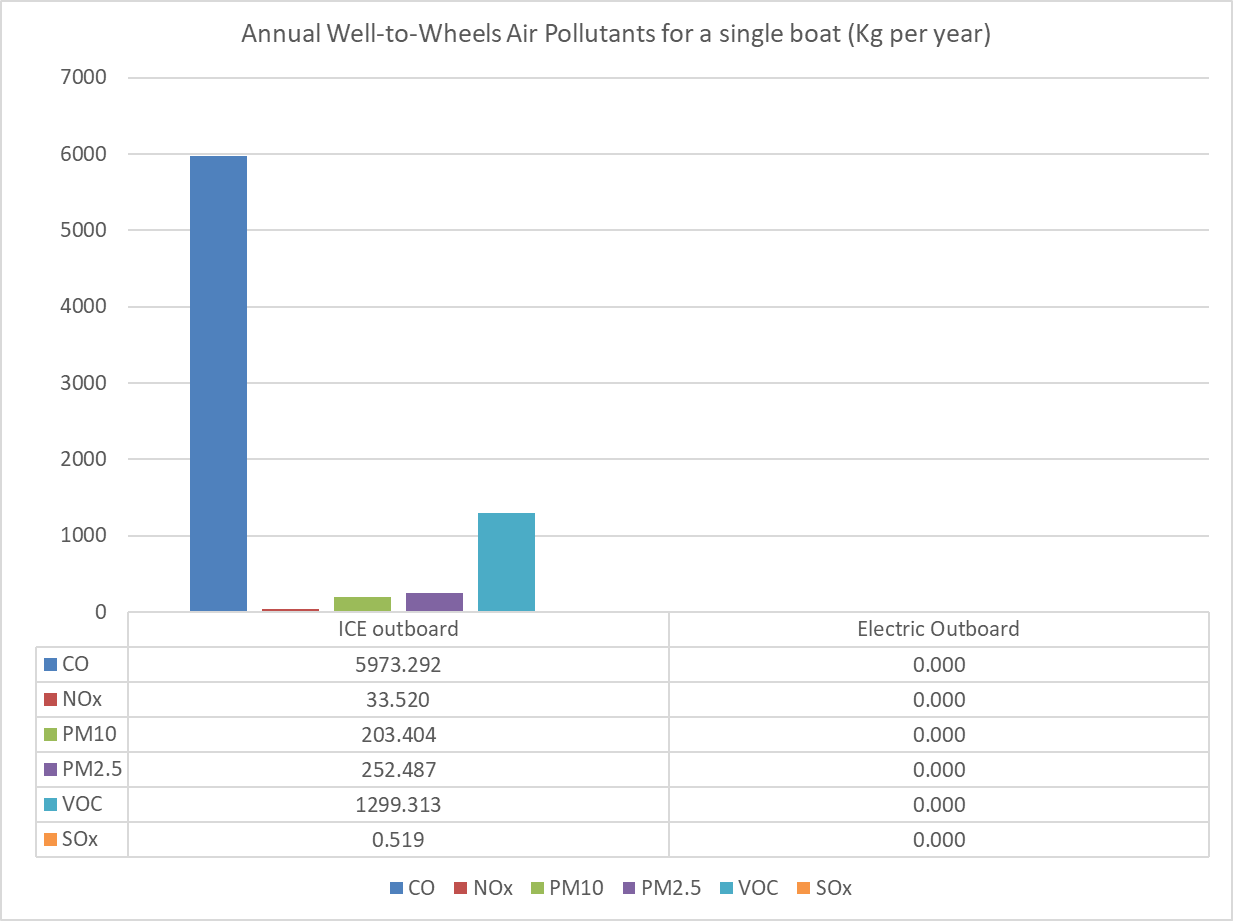
The following chart and table compares the main categories of air pollutants emissions. The main pollutant in terms of weight is the carbon monoxide (CO) and volatile organic compounds (VOC).
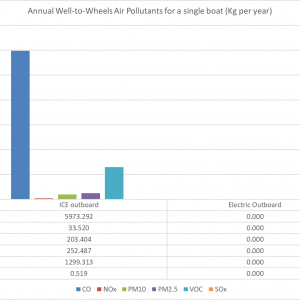
In the categories of impact analyzed, the e-outboard is emission free, apart from some GHG emissions related to electricity generation. However, it is important to highlight some caveats that should be considered when interpreting the result of this study. One is that we did not consider the impact of the production of the outboard components and accessories, given that this analysis only focused on the use phase. It can be expected that the manufacturing phase of the e-outboard system will have a higher environmental impact than the ICE outboard since it also requires a battery bank. Similarly, the end-of-life management phase of the LCA can also be expected to be higher for the e-outboard option due to the batteries, especially if the storage systems are not repurposed for secondary applications. Lastly, the result of the assessment will be significantly different if the energy used to charge the e-outboard is not 100% renewable as assumed in this study.
Result of Economic Impact Assessment
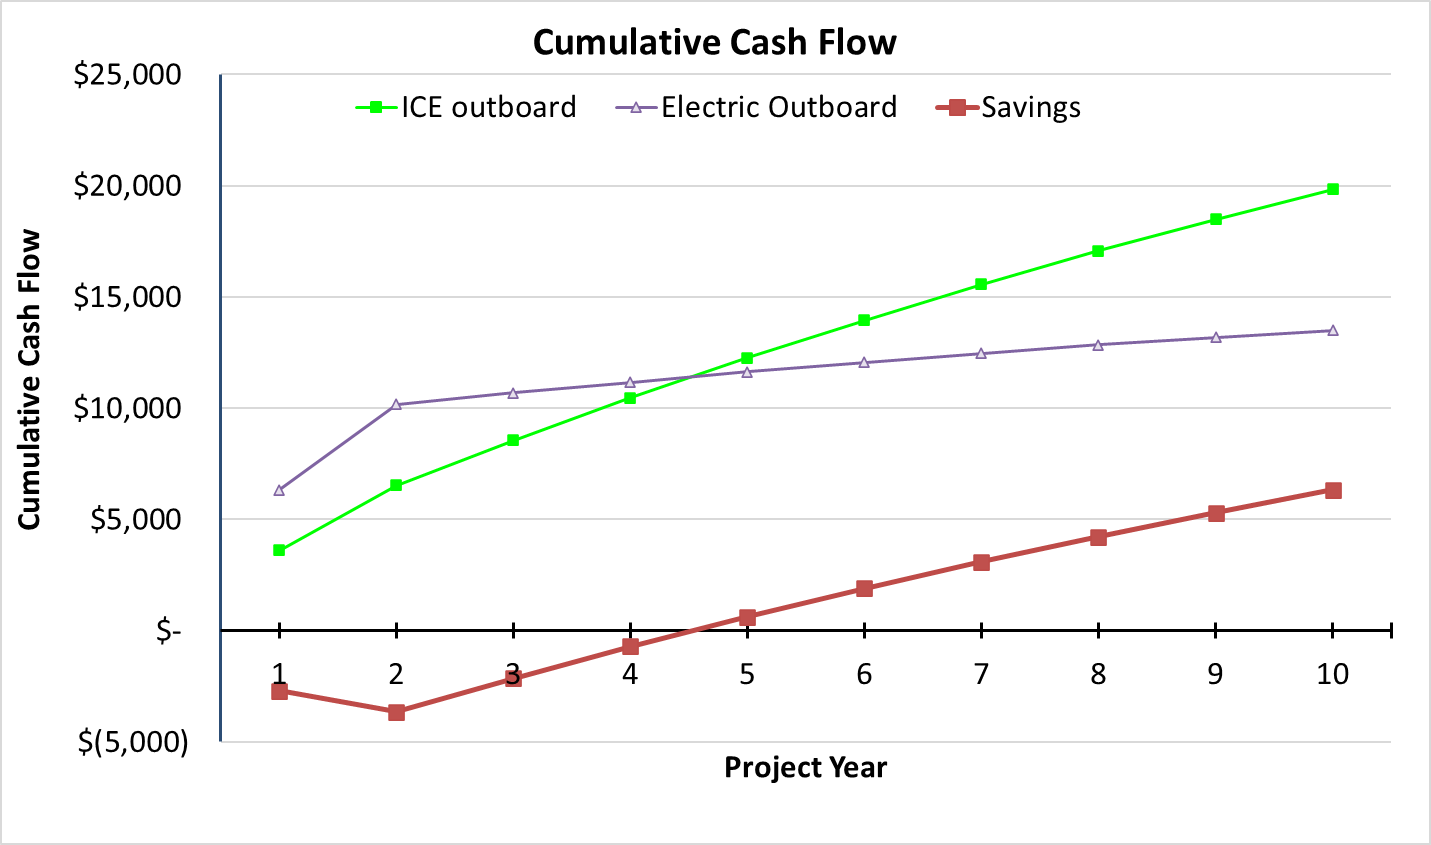
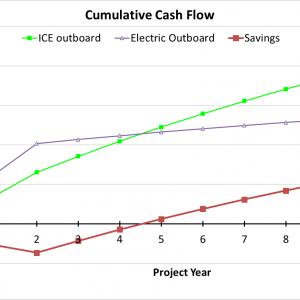
The electric outboards have a higher initial acquisition costs but have lower operational and maintenance costs. The breakeven point from our analysis is around 4 years. With simple payback calculation, which does not consider the effect of inflation and the time value of money, the payback is 3.2 years. In the Cumulative Cash Flow chart, it can be seen that the negative cash flow due to the installments paid to the financing institution are significant for the electric outboard, which has the highest initial investment cost and, thus, interests. It is important to notice that in this case no revenues are considered, therefore the Cash Flows are equal to expenditures.
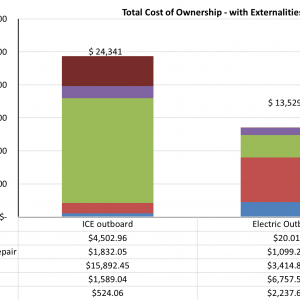
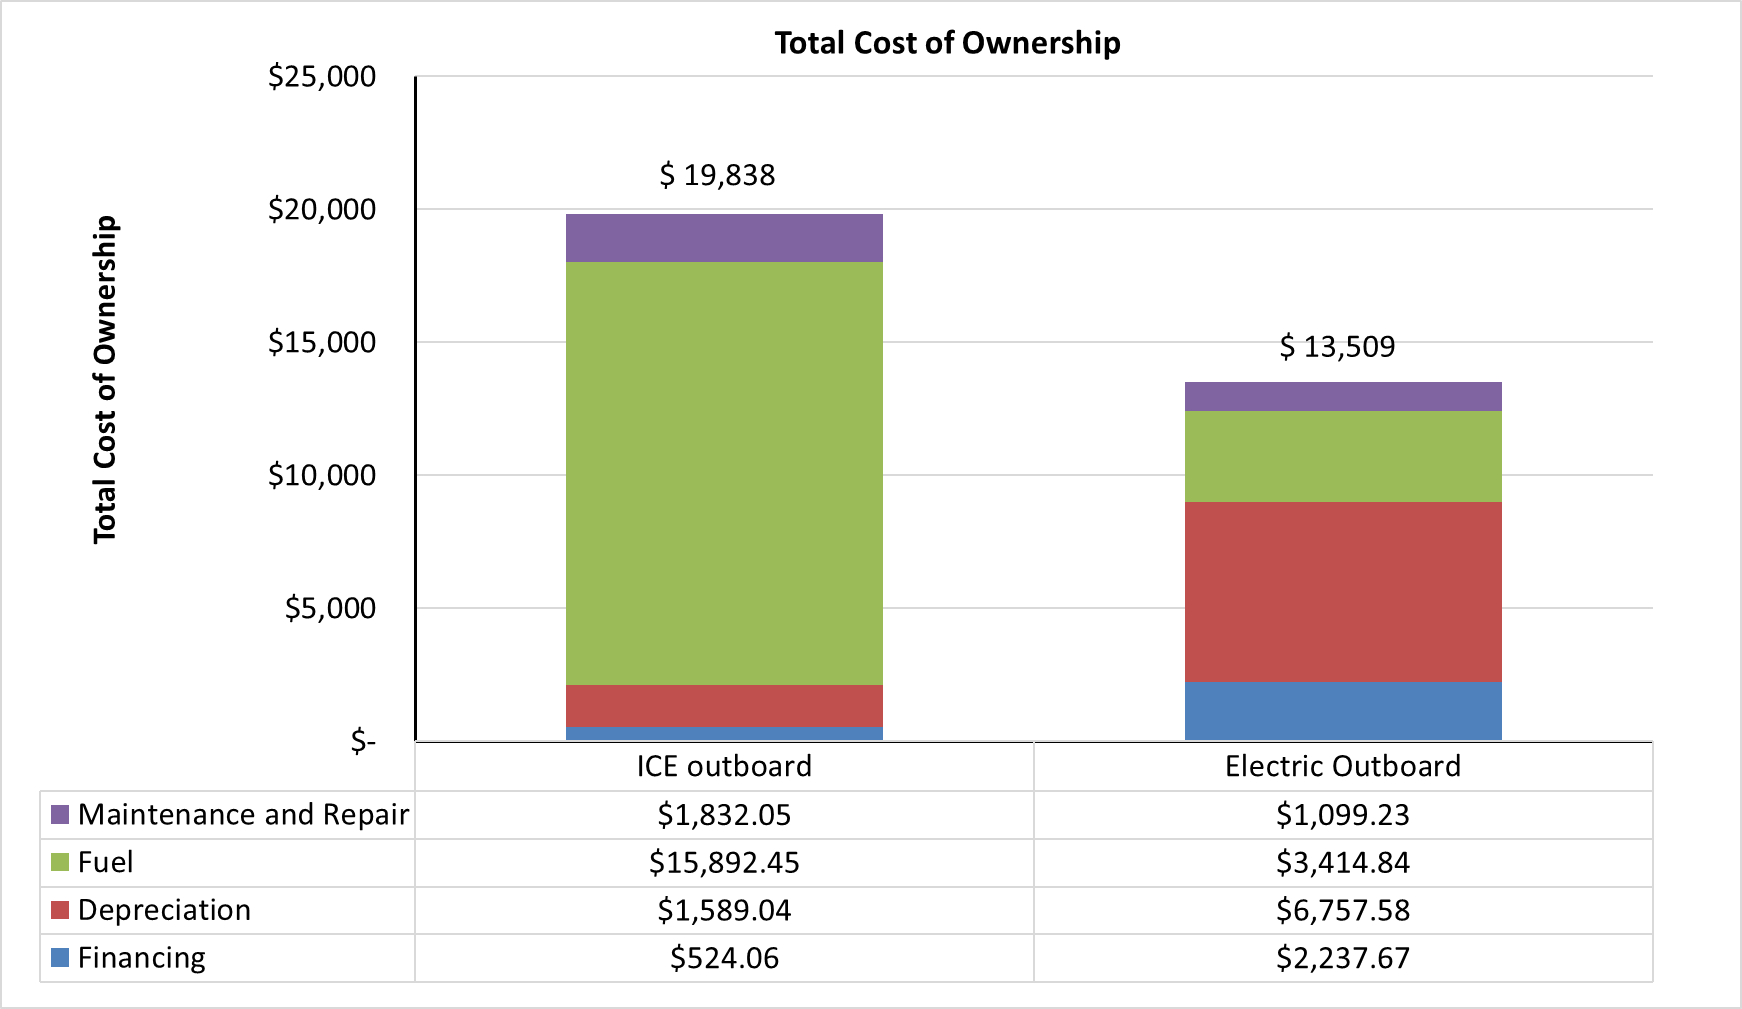
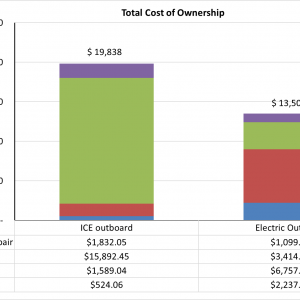
The stacked bar chart below shows that while fuel consumption is responsible for most of the cost of the diesel ICE outboard, the Total Cost of Ownership (TCO) of the e-outboard is primarily driven by the cost of the equipment (depreciation).
At the end of the 10 years, the total TCO for an ICE outboard and the e-outboard are $19,838 and $13,509 respectively. This means that over the lifetime of the outboard, a customer choosing an electric propulsion should expect savings for about $6,328.
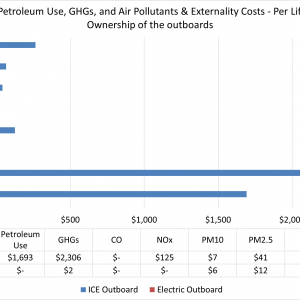
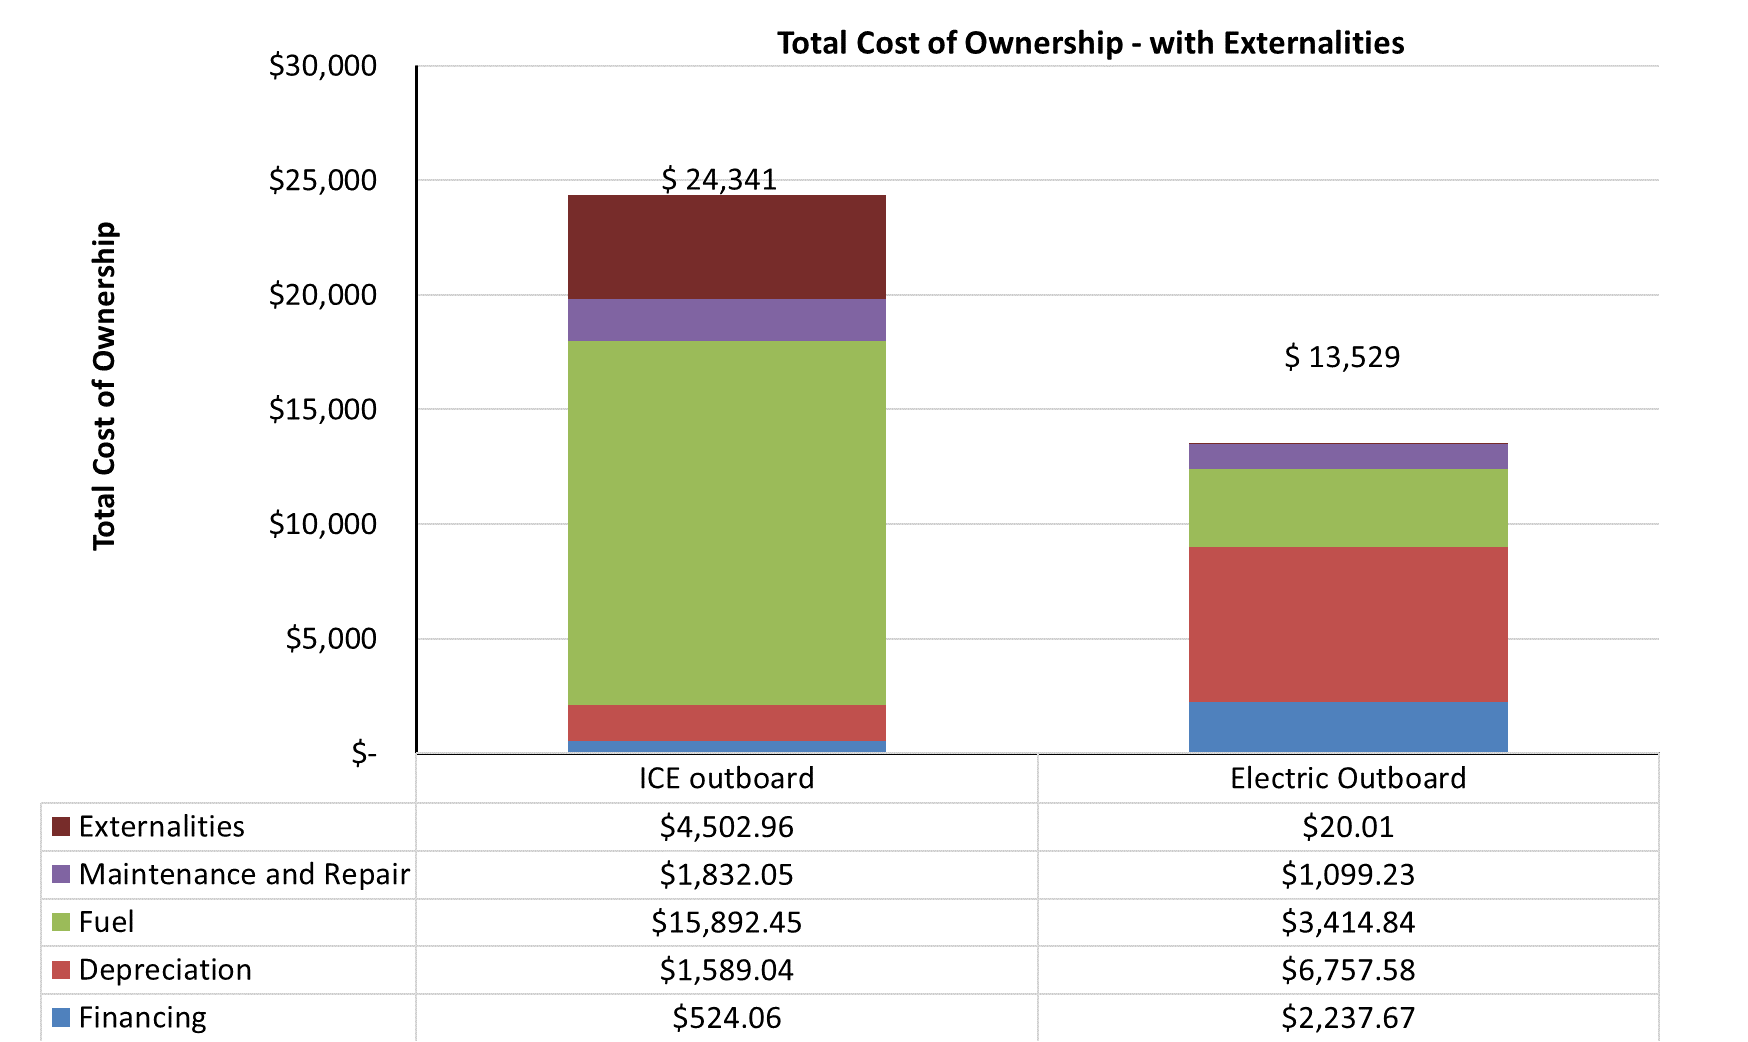
Furthermore, to account for the reduced environmental impact of the e-outboard use, an economic value was assigned to the emissions from both technologies and then added to the TCO, as externalities. This approach is often used by governments and agencies when assessing roadmaps and strategies to quantify costs associated with pollution. All the externality values were adopted from AFLEET; in particular the petroleum use externality was valued at $16.95 (2020 $) per barrel, and the social cost of CO2 was taken as 41 $/metric ton (2020 $).
The results show that GHG and Petroleum Use account for most of the externality costs. Factoring the externalities into the TCO increases the TCO of the ICE outboard to $24,341 and that of the e-outboard to $13,529.